
Monitoring and Incident Response for Deployed Healthcare ML Models: Drift, Abuse, and Data Leaks
Updated on January 29, 202620 minutes read
Deploying an ML model into a healthcare workflow is less like “shipping a feature” and more like operating a safety‑critical subsystem. A model can return valid HTTP responses while quietly becoming wrong because the patient population changed, the EHR interface changed, or clinical practice changed.
At the same time, healthcare ML systems are prime targets for misuse. Even “ordinary” API security mistakes can become a PHI incident, and overly verbose logging can leak sensitive clinical context faster than most teams expect.
This guide is for ML engineers, MLOps/SRE practitioners, and security-aware data teams who already know the basics of modeling and deployment. The goal is to go beyond dashboards and build monitoring signals and response playbooks that hold up under real operational pressure.
After reading, you should be able to design a monitoring signal map for healthcare ML, implement drift and data-quality detection in Python, and run an incident response workflow for model regressions, security anomalies, and privacy incidents. You should also understand how to build telemetry that is useful for debugging while staying compatible with healthcare privacy constraints.
Background and prerequisites for healthcare ML monitoring
You should be comfortable with Python, basic statistics, and at least one common ML workflow (training, evaluation, deployment). You don’t need to be a clinician, but you do need enough clinical context to interpret features and understand how clinicians use model outputs.
Healthcare data is unusually “operational.” Many features are byproducts of care processes (orders, labs, transfers), so changes in workflow can change the meaning of the data even when the schema is unchanged.
Most production healthcare pipelines touch interoperability standards. HL7 FHIR is a widely used standard for exchanging healthcare information electronically, and it often appears in integration pipelines that feed deployed models.
Privacy constraints also change what “normal observability” looks like. In U.S. contexts, the HIPAA Security Rule establishes safeguards for electronic protected health information (ePHI), and those safeguards affect how you log, trace, store, and share telemetry.
Finally, incident response in healthcare ML is not only a security discipline. It is also how you prevent patient harm when a model’s behavior or data pipeline degrades while the service still appears “up.”

The deployed healthcare ML problem: performance decay happens quietly
A deployed model sits inside a feedback loop. Clinicians react to model outputs, which change future data, and future data changes model performance in ways your offline tests never saw.
This is why “training AUC was great” is not an operational metric. It’s a historical fact, and healthcare is full of events that invalidate historical facts, including seasonal disease patterns, changes in triage policies, and guideline updates.
Healthcare also has a label delay. If your model predicts readmission or deterioration, the ground truth might arrive days or weeks later, which means you need monitoring signals that work even when outcomes are not yet known.
The net result is that monitoring must combine classic SRE signals (latency, errors) with ML-specific signals (drift, calibration) and security/privacy signals (abuse patterns, leakage indicators).
Core theory and intuition: drift, calibration, abuse, and leakage
Drift is not one thing
In monitoring, “drift” is often used as a catch-all. Operationally, you want to distinguish different types of change because they imply different fixes.
Covariate shift means the input distribution changes: changes while is roughly stable. In healthcare, this can happen when a hospital opens a new unit, changes referral patterns, or expands eligibility criteria.
Label shift means the base rate changes: changes while stays relatively stable. This can happen when care improves, and adverse outcomes become rarer, even if patients look similar.
Concept drift means the relationship changes: changes. This is the hardest case because it can mean your features no longer encode the same clinical meaning, or the endpoint definition has effectively changed in practice.
A good monitoring program treats drift as a diagnostic pointer. The same drift metric can indicate benign population change or a catastrophic unit-conversion bug.
Why we monitor distributions (and not just accuracy)
If labels are delayed, you need leading indicators. Distribution shift metrics let you spot changes before you can compute AUCPR or calibration on fresh outcomes.
A practical mental model is “monitor what you can observe immediately.” That includes feature distributions, missingness, out-of-range rates, and the distribution of the model’s own predictions.
Prediction drift is especially useful in healthcare because changes in alert volumes are operationally visible. If your risk scores shift upward, clinicians will feel it even if you haven’t computed supervised metrics for the new cohort.
A simple, useful drift metric: Population Stability Index (PSI)
For tabular healthcare ML, the Population Stability Index (PSI) is popular because it is easy to compute, explain, and alert on.
You bin a feature using baseline data, then compare baseline proportions to current proportions across bins. PSI is:
If PSI is near zero, the distributions are similar. If PSI grows, your current data looks less like what the model was trained on.
PSI is not the “truth” about performance. It is a smoke detector, and in healthcare operations, smoke detectors are valuable because they ttriggeran investigation before you have a fire.
Why calibration matters in clinical workflows
Many healthcare models are used as risk scores, not just classifiers. That means the predicted probability is treated as clinically meaningful, especially when thresholds drive alerts or clinician review.
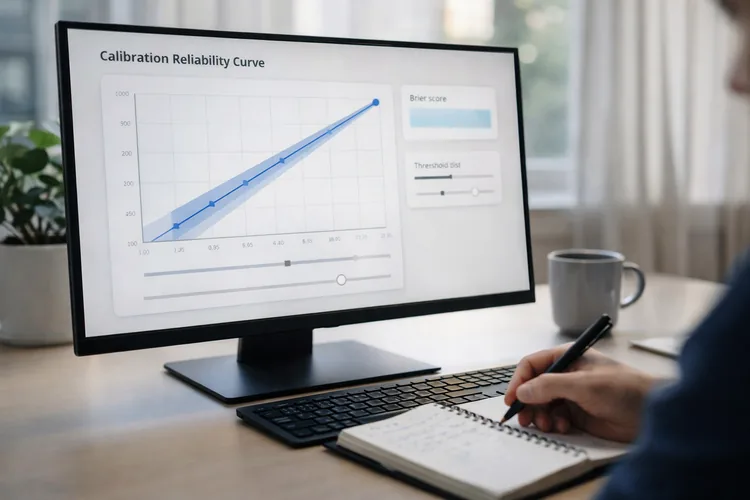
A model can keep a stable ROC AUC while becoming miscalibrated. Clinically, miscalibration can cause too many false alerts (alert fatigue) or too few alerts (missed deterioration).
Two widely used calibration metrics are the Brier score and the Expected Calibration Error (ECE). The Brier score is:
ECE is bin-based and measures the gap between predicted confidence and observed outcome rates within probability bins:
In practice, calibration drift often becomes visible as workflow disruption. If the score distribution shifts, your alert threshold may no longer correspond to the intended clinical burden.
Abuse monitoring: your inference service is still an API
Security incidents in healthcare ML are frequently “ordinary” API problems. Broken authorization, excessive data exposure, and weak authentication patterns show up in ML services the same way they show up in any other API.
OWASP’s API Security Top 10 is a useful starting point because it describes common failure modes, such as broken object-level authorization and broken object-property-level authorization. In an ML system, these map directly to “the endpoint returned data it shouldn’t” or “a client could query data outside its scope.”
In an ML context, abuse can also include model-specific threats. Attackers may attempt model extraction by querying systematically, or attempt membership inference by probing confidence signals.
Your operational goal is not perfection. It is early detection, limited blast radius, and service design that do not make sensitive inference easier than it needs to be.
Data leaks: the quiet incident class in healthcare ML
Healthcare ML leaks often come from telemetry and data plumbing, not from the model itself. A debugging statement that prints a request body can create a reportable PHI incident.
This is why governance should treat logs and metrics pipelines as part of your regulated data surface. If you operate under HIPAA-like constraints, safeguards, a nd auditability expectations push you toward minimal, structured logging and strong access controls around telemetry.
If you operate under GDPR-like regimes, personal data breach notification duties can be time-sensitive. This makes prevention (safe logging by default) far cheaper than cleanup after data has already propagated.
Hands-on implementation in Python: drift + quality monitoring for a healthcare risk model
This section builds a realistic foundation using tabular, EHR-like data. The point is not to build the best classifier, but to build monitoring primitives you can reuse with any model.
We’ll generate synthetic readmission-style data, train a calibrated baseline model, store baseline distributions, and compute drift and quality checks on a simulated production batch.
Step 1: Create EHR-like tabular data and train a baseline model
import numpy as np
import pandas as pd

from sklearn.model_selection import train_test_split
from sklearn.import ColumnTransformer
from sklearn.pipeline import Pipeline
from sklearn.preprocessing import OneHotEncoder, StandardScaler
from sklearn.impute import SimpleImputer
from sklearn.linear_model import LogisticRegression
from sklearn.calibration import CalibratedClassifierCV
from sklearn.metrics import roc_auc_score, average_precision_score, brier_score_loss

rng = np.random.default_rng(42)

def make_synthetic_readmission_data(n: int, drift: bool = False) -> pd.DataFrame:
    """
    Synthetic EHR-like readmission dataset.
    drift=True simulates a population/pipeline shift that might happen after deployment.
    """
    age = rng.normal(loc=68 if drift else 62, scale=12, size=n).clip(18, 95)
    sex = rng.choice(["F", "M"], size=n, p=[0.52, 0.48])

    systolic_bp = rng.normal(loc=132 if drift else 128, scale=18, size=n).clip(80, 220)
    heart_rate = rng.normal(loc=86 if drift else 82, scale=14, size=n).clip(35, 180)

    creatinine = rng.lognormal(mean=np.log(1.1 if drift else 0.95), sigma=0.35, size=n).clip(0.4, 8.0)
    wbc = rng.normal(loc=9.0 if drift else 8.2, scale=2.3, size=n).clip(2.0, 35.0)

    prior_admissions_12m = rng.poisson(lam=1.2 if drift else 0.9, size=n).clip(0, 12)
    length_of_stay = rng.lognormal(mean=np.log(4.2 if drift else 3.6), sigma=0.5, size=n).clip(0.5, 45)

    discharge = rng.choice(
        ["home", "snf", "rehab", "ama"],
        size=n,
        p=[0.68 if drift else 0.72, 0.20 if drift else 0.17, 0.10, 0.02]
    )

    # Missingness increases slightly under drift (e.g., upstream interface issue).
    missing_rate = 0.08 if drift else 0.05
    creatinine = creatinine.astype(float)
    wbc = wbc.astype(float)
    creatinine[rng.random(n) < missing_rate] = np.nan
    wbc[rng.random(n) < missing_rate] = np.nan

    df = pd.DataFrame({
        "age": age,
        "sex": sex,
        "systolic_bp": systolic_bp,
        "heart_rate": heart_rate,
        "creatinine": creatinine,
        "wbc": wbc,
        "prior_admissions_12m": prior_admissions_12m,
        "length_of_stay": length_of_stay,
        "discharge": discharge,
    })

    # Synthetic label generation (for demonstration only).
    creat_missing = df["creatinine"].isna().astype(float)
    wbc_missing = df["wbc"].isna().astype(float)

    linear = (
        -4.0
        + 0.03 * (df["age"] - 60)
        + 0.015 * (df["systolic_bp"] - 120)
        + 0.02 * (df["heart_rate"] - 80)
        + 0.55 * np.nan_to_num(df["creatinine"], nan=1.1)
        + 0.06 * np.nan_to_num(df["wbc"], nan=8.0)
        + 0.25 * df["prior_admissions_12m"]
        + 0.10 * df["length_of_stay"]
        + 0.35 * (df["discharge"] == "snf").astype(float)
        + 0.60 * (df["discharge"] == "ama").astype(float)
        + 0.15 * creat_missing
        + 0.10 * wbc_missing
        + 0.12 * (df["sex"] == "M").astype(float)
    )

    prob = 1.0 / (1.0 + np.exp(-linear))
    df["readmit_30d"] = rng.binomial(1, prob.clip(0, 1), size=n)
    return df

baseline_df = make_synthetic_readmission_data(n=12000, drift=False)
X = baseline_df.drop(columns=["readmit_30d"])
y = baseline_df["readmit_30d"]

X_train, X_test, y_train, y_test = train_test_split(
    X, y, test_size=0.2, random_state=42, stratify=y
)

numeric_features = ["age", "systolic_bp", "heart_rate", "creatinine", "wbc",
                    "prior_admissions_12m", "length_of_stay"]
categorical_features = ["sex", "discharge"]

numeric_pipe = Pipeline(steps=[
    ("imputer", SimpleImputer(strategy="median")),
    ("scaler", StandardScaler())
])

categorical_pipe = Pipeline(steps=[
    ("imputer", SimpleImputer(strategy="most_frequent")),
    ("onehot", OneHotEncoder(handle_unknown="ignore"))
])

preprocess = ColumnTransformer(
    transformers=[
        ("num", numeric_pipe, numeric_features),
        ("cat", categorical_pipe, categorical_features),
    ]
)

base_model = LogisticRegression(max_iter=300, class_weight="balanced")

# Calibrate probabilities to make risk scores more clinically meaningful.
model = Pipeline(steps=[
    ("preprocess", preprocess),
    ("clf", CalibratedClassifierCV(base_model, method="sigmoid", cv=3))
])

model.fit(X_train, y_train)
Even in this toy setup, the calibrated probability output is what you will later threshold for alerts. In healthcare ops, the probability distribution often matters as much as ranking metrics.
Now evaluate using metrics that make sense for rare outcomes. AUCPR is often more informative than ROC AUC when the positive class is uncommon, and the Brier score is a direct signal for calibration.
proba_test = model.predict_proba(X_test)[:, 1]

roc_auc = roc_auc_score(y_test, proba_test)
auprc = average_precision_score(y_test, proba_test)
brier = brier_score_loss(y_test, proba_test)

print(f"ROC AUC: {roc_auc:.3f}")
print(f"AUCPR:   {auprc:.3f}")
print(f"Brier:   {brier:.3f}")
Step 2: Store baseline distributions and compute PSI in production batches
In production, you rarely want to store raw baseline values for monitoring. You usually store histograms or quantile bin edges so you can compute drift from aggregate counts.
Quantile-based bins are practical for lab values because many clinical measurements are skewed. They also produce bins with non-trivial mass, which stabilizes PSI.
def make_quantile_bins(df: pd.DataFrame, col: str, n_bins: int = 10) -> np.ndarray:
    x = df[col].dropna().to_numpy()
    edges = np.unique(np.quantile(x, np.linspace(0, 1, n_bins + 1)))
    if len(edges) < 3:
        edges = np.array([np.nanmin(x), np.nanmax(x)])
    return edges

def psi(baseline: pd.Series, current: pd.Series, edges: np.ndarray, eps: float = 1e-6) -> float:
    b = baseline.dropna().to_numpy()
    c = current.dropna().to_numpy()

    b_counts, _ = np.histogram(b, bins=edges)
    c_counts, _ = np.histogram(c, bins=edges)

    b_dist = b_counts / max(b_counts.sum(), 1)
    c_dist = c_counts / max(c_counts.sum(), 1)

    b_dist = np.clip(b_dist, eps, 1.0)
    c_dist = np.clip(c_dist, eps, 1.0)

    return float(np.sum((c_dist - b_dist) * np.log(c_dist / b_dist)))

baseline_bins = {col: make_quantile_bins(X_train, col, n_bins=12) for col in numeric_features}
Now simulate a production batch with drift. In a real system, “prod batch” might be the last hour of discharges or the last day of ED arrivals, depending on workflow.
prod_df = make_synthetic_readmission_data(n=2500, drift=True)
X_prod = prod_df.drop(columns=["readmit_30d"])
y_prod = prod_df["readmit_30d"]  # in reality, this arrives later

psi_scores = {col: psi(X_train[col], X_prod[col], baseline_bins[col]) for col in numeric_features}
print(sorted([(k, round(v, 3)) for k, v in psi_scores.items()], key=lambda t: -t[1])[:5])
PSI only helps if it triggers an investigation. The operational trick is to standardize what “investigation” means; teams debate thresholds while the system keeps changing.
A common pattern is to treat PSI as tiered. Mid-range PSI opens an investigation ticket, while sustained high PSI across multiple core features can justify paging because it often indicates a pipeline defect or a major distribution shift.
Step 3: Add data quality checks that catch dangerous failures
In healthcare, the scariest failures are often not “the population changed.” They are “the units changed” or “the field mapping broke.”
That’s why missingness and out-of-range checks are foundational. They are blunt instruments, but they catch issues that drift metrics may not catch reliably.
def missing_rate(df: pd.DataFrame, col: str) -> float:
    return float(df[col].isna().mean())

def out_of_range_rate(df: pd.DataFrame, col: str, lo: float, hi: float) -> float:
    x = df[col]
    return float(((x < lo) | (x > hi)).mean())

dq = {
    "missing_creatinine": missing_rate(X_prod, "creatinine"),
    "missing_wbc": missing_rate(X_prod, "wbc"),
}

# In a real hospital pipeline, define these ranges with clinical SMEs.
ranges = {
    "systolic_bp": (70, 250),
    "heart_rate": (25, 220),
    "creatinine": (0.3, 10.0),
    "wbc": (1.0, 50.0),
}

oor = {col: out_of_range_rate(X_prod, col, lo, hi) for col, (lo, hi) in ranges.items()}

print(dq)
print(oor)
If you implement only one “ML monitoring feature” early, implement out-of-range checks with clinician-approved ranges. This is one of the highest signal-to-noise safety controls you can ship quickly.
Step 4: Monitor prediction distribution drift as an operations signal
Even if feature drift is ambiguous, prediction drift is often operationally meaningful because it correlates with alert burden and workflow changes.
This is also where you can monitor suspicious usage patterns. Attackers probing a model can create unusual clustering or tail behavior in the score distribution.
baseline_scores = model.predict_proba(X_train)[:, 1]
prod_scores = model.predict_proba(X_prod)[:, 1]

score_edges = np.unique(np.quantile(baseline_scores, np.linspace(0, 1, 12)))
score_psi = psi(pd.Series(baseline_scores), pd.Series(prod_scores), score_edges)

print("Prediction PSI:", round(score_psi, 3))
In production, you’ll often track a small set of “score distribution facts” as metrics. The mean, p50, p90, and p99 of the risk score are frequently enough to spot workflow-impacting shifts without storing patient-level outputs.
Systems and production operations: what to monitor and how to wire it up
Use an observability stack that supports privacy-safe aggregation
A typical production approach is to export metrics, logs, and traces from the model service and the data pipeline. The core design decision is what you export as aggregates versus what you keep internally for restricted forensic access.
OpenTelemetry’s security guidance highlights handling sensitive data and describes using Collector processors (for example, redaction) to scrub sensitive attributes before export. This matters in healthcare because the observability pipeline is often the fastest way for sensitive strings to escape into systems that were never meant to store PHI.
Collector-side scrubbing does not replace good application logging discipline. It is a safety net that reduces blast radius when humans do human things, especially during incidents.

Separate “online” and “offline” monitoring because labels are delayed
Online monitoring is about immediate operational safety. It covers uptime, latency, schema checks, missingness spikes, out-of-range spikes, and large prediction distribution shifts.
Offline monitoring is about model validity over time. It joins predictions to outcomes when labels arrive, then computes AUCPR, calibration drift, and clinically relevant subgroup metrics on well-defined cohorts.
Healthcare teams often fail by mixing these. They either wait for delayed labels before reacting, or they page on weak drift signals without a clear clinical action.
Treat data contracts as safety controls, not as bureaucracy
Most drift “incidents” turn out to be pipeline changes. A field was renamed, a code system changed, a unit changed, or missingness patterns changed because a lab panel was reordered.
Your best defense is a feature schema contract that is versioned and validated. You should validate types, ranges, allowed categorical values, and missingness expectations before calling the model.
This is especially important in healthcare integration because upstream systems change with vendor upgrades. FHIR resources may be stable in shape, but mappings and clinical codes still evolve.
A concrete example: PHI-safe logging for a model API
A common mistake is logging the request payload “for debugging.” In healthcare, you want to log only what you can defend in an audit.
Below is a minimalist FastAPI example that logs only the schema version, model version, and basic quality counters. It avoids logging feature values.
from fastapi import FastAPI, Request
import time
import json
import hashlib

from prometheus_client import Counter, Histogram, generate_latest, CONTENT_TYPE_LATEST
from starlette. responses import Response

app = FastAPI()

MODEL_VERSION = "readmit_lr_calibrated_v2026_01_28"
FEATURE_SCHEMA_VERSION = "ehr_features_v3"

REQ_COUNT = Counter("ml_infer_requests_total", "Total inference requests")
REQ_LATENCY = Histogram("ml_infer_latency_seconds", "Inference latency seconds")

def safe_hash(value: str) -> str:
    # Useful when you need correlation without storing raw identifiers.
    return hashlib.sha256(value.encode("utf-8")).hexdigest()[:12]

@app.post("/predict")
async def predict(request: Request):
    start = time.time()
    REQ_COUNT.inc()

    payload = await request.json()

    # Do NOT log raw payload in healthcare contexts.
    # Extract only non-sensitive operational metadata.
    client_id = payload.get("client_id", "unknown")
    client_tag = safe_hash(client_id)

    # Example data-quality counters computed on the fly (toy example).
    missing_count = 0
    for k in ["creatinine", "wbc"]:
        if payload.get(k) is None:
            missing_count += 1

    # Minimal structured log: safe fields only.
    log_record = {
        "event": "inference",
        "model_version": MODEL_VERSION,
        "schema_version": FEATURE_SCHEMA_VERSION,
        "client": client_tag,
        "missing_labs": missing_count,
    }
    print(json.dumps(log_record))

    # TODO: run real preprocessing + model inference here
    score = 0.17

    REQ_LATENCY.observe(time.time() - start)
    return {"model_version": MODEL_VERSION, "risk_score": score}

@app.get("/metrics")
def metrics():
    return Response(generate_latest(), media_type=CONTENT_TYPE_LATEST)
This example is intentionally boring. In healthcare, boring observability is often safer and more sustainable than “log everything and search later.”
Incident response for healthcare ML: playbooks that match failure modes
Incident response needs to be defined before you’re under pressure. If you wait to invent your playbook during a drift incident, you will argue about metrics while clinicians experience workflow harm.
A modern reference for incident response in cybersecurity risk management is NIST SP 800-61 Rev. 3. It aligns incident response to broader cyber risk management activities and supersedes Rev. 2.
In healthcare ML, you still want the same phases: detection, triage, containment, recovery, and post-incident learning. The difference is that “model quality incidents” must be treated as operational incidents, not just analytics tasks.
Incident class 1: model quality incident (drift, regression, calibration break)
A model quality incident starts when leading indicators suggest the model is no longer behaving like it did at validation time. In healthcare, urgent cases include alert volume shifts, out-of-range inputs, and pipeline changes that make scores untrustworthy.
Triage begins by asking whether this is data plumbing or a true population shift. You check schema versions, missingness spikes, unit mismatches, and upstream vendor changes before blaming the model.
Containment is workflow-driven. If outputs trigger alerts, containment may mean raising the threshold, switching to a previous model version, or temporarily disabling automated downstream actions while continuing to collect aggregate signals.
Recovery is not just retraining. It can include recalibration, updated feature engineering, revised cohort definitions, or even a governance decision that the model should be retired because the clinical setting changed.
Incident class 2: security anomaly or abuse of the inference API
Security anomalies often present as traffic spikes, elevated authentication failures, unusual request clustering, or systematic probing patterns. In healthcare, availability and integrity matter because downtime can disrupt care workflows.
Immediate containment tools are standard API defenses. Rate limiting at the gateway, strict authentication, and narrow authorization are still the first line of defense.
OWASP’s API Security Top 10 is useful here because it focuses attention on authorization failures and excessive exposure. In ML services, those failures can turn quickly into unauthorized disclosure or unbounded query access.
After containment, the investigation should correlate requests using trace IDs and safe client identifiers. You want to learn whether this was misconfigured client software, internal misuse, or external probing without pulling raw PHI into ad hoc notebooks.
Incident class 3: privacy incident or suspected PHI leakage
Privacy incidents often begin with a discovery: PHI appears in logs, a monitoring table contains identifiers, or a storage bucket shows unusual access patterns.
Your first action is containment. Disable verbose logging, restrict access to affected systems, and preserve evidence.
If your organization is subject to HIPAA, the Breach Notification Rule describes notification expectations following breaches of unsecured PHI. If your organization is subject to GDPR-like regimes, personal data breach notification duties, including rapid authority notification in applicable cases, can be relevant.
Treat this section as operational guidance, not legal advice. Your incident workflow should be pre-approved by compliance and counsel, and your engineers should execute a checklist rather than invent policy during an outage.
Governance, safety, and compliance: aligning monitoring with real obligations
Governance should make monitoring actionable, not ceremonial. Without governance, “the dashboard looks weird” becomes a recurring argument rather than a decision.
NIST’s AI Risk Management Framework (AI RMF 1.0) is useful because it frames AI risk management across lifecycle functions. It encourages teams to treat AI as socio-technical and to connect measurement to management actions.
Regulatory regimes also affect operations. The EU AI Act applies progressively, and the EU’s official timeline communicates staged applicability and a full rollout horizon, which matters if you deploy high-risk systems into healthcare contexts in the EU.
If you build ML that could be treated as a medical device function, Good Machine Learning Practice (GMLP) guiding principles are a relevant quality and lifecycle lens. They reinforce disciplined data management, monitoring, and change control.

Case study scenario: a sepsis risk model under drift, abuse, and a logging near-miss
Imagine a sepsis early warning model running in an inpatient setting. The model consumes vitals, labs, medication signals, and unit context, then outputs a risk score that triggers clinician review above a threshold.
Two months after deployment, drift monitoring flags a major PSI increase in lactate and creatinine, and the prediction distribution shifts upward. Clinicians report a sudden rise in alerts and growing alert fatigue.
Triage finds that a lab analyzer update changed measurement calibration and increased missingness for a specific lab panel. This is not just a population shift; it is a measurement and pipeline event that affects model reliability.
Containment focuses on workflow stability. You temporarily raise the alert threshold and add a banner in the clinical UI indicating the model is under investigation, while validating whether alerts remain clinically meaningful.
Recovery includes recalibration on recent data and a controlled rollout, because sepsis workflows are sensitive to alert burden. The post-incident action is to add a dedicated “lab instrument/version” signal to monitoring and to tighten range checks.
A week later, your API gateway reports traffic spikes to the inference endpoint from an unknown client. Authentication failures rise, and request patterns look like systematic probing rather than clinical traffic.
Containment is a classic API defense: strict allowlisting, rate limiting, and token rotation. The investigation focuses on whether this was misconfigured internal integration or external probing, without exporting raw payloads into unsafe places.
Finally, you discover that during earlier debugging, a developer enabled verbose logging that printed partial payloads. A DLP scan flags note-like strings in centralized logs, creating a potential PHI leakage path.
You can contain by shutting off verbose logs, restricting access to affected log indexes, and preserving evidence. Your governance workflow determines whether notifications are required based on scope, access patterns, and whether data was unsecured.
Skills mapping and learning path for bootcamp-style learners
From a software engineering perspective, this topic builds the bridge between “I can train and deploy a model” and “I can operate a healthcare ML system responsibly.” It pushes you to treat data pipelines, monitoring, and incident response as core product features—not side tasks.
From an ML perspective, you deepen your grasp of calibration, cohort evaluation under label delay, drift detection, and how metrics translate into clinical workflow effects. This is the difference between a model that looks good in notebooks and a model that stays useful in a hospital.
From a security and compliance perspective, you practice PHI-safe observability, threat modeling for inference services, and structured incident workflows that produce audit-ready evidence. API hardening and privacy-safe telemetry pipelines become part of MLOps in healthcare, not “security team extras.”
A realistic next step is to build a small inference service with safe logging, expose metrics, run batch drift jobs daily, and then run a tabletop exercise simulating a unit-conversion bug. The goal is to make containment and recovery muscle memory.
If you want a structured path and guidance on which bootcamp track fits your goals (Data Science & AI vs. Cyber Security), schedule a 1:1 call with Code Labs Academy Schedule a call with our admissions team
Conclusion
Monitoring deployed healthcare ML models is not a single dashboard. It is an operational system that connects statistical signals, software reliability signals, and security/privacy signals to concrete response actions.
Drift metrics like PSI are valuable because they function as smoke detectors when labels are delayed. They only help when paired with data contracts, range checks, and a clear investigation workflow.
Calibration deserves first-class monitoring in clinical risk models. The cost of miscalibration often shows up as alert fatigue or missed deterioration rather than a dramatic AUC collapse.
Security anomalies and data leaks often originate from ordinary API and logging mistakes. That’s why OWASP-aligned API hardening and privacy-safe telemetry pipelines are part of healthcare MLOps.
Key takeaways:
- Treat drift as a diagnostic signal and pair it with data quality controls that catch pipeline failures fast.
- Monitor calibration because clinical thresholds and alert burden depend on probability quality, not just ranking.
- Assume your model is an API and monitor for abuse patterns the same way you would any critical endpoint.
- Make observability PHI-safe by default, and use collector-side scrubbing as a safety net.